circuit breaker 가 오픈되었는지 닫혀있는지를 확인하려면 대시보드가 필요하다는 생각이 든다.
예전에 histrix 를 이용할때는 turbin 이라는 모니터링이 있던거로 기억하는데, spring cloud gateway 의 circuit breaker 인
Resilience4j 는 없다.
Resilience4j 에는 모니터링 툴이 존재 하지 않아 micormeter 로 metric 제공하는 내용으로 모니터링을 직접 구성해야 한다.
메트릭을 수집하고 표현하는 대시보드는 prometheus 와 grafana 로 모니터링을 할 수 있다.
준비
1. Prometheus 설치
2. grafana 설치
스프링 yml
cloud:
gateway:
routes:
- id: test
uri: http://localhost:9091
predicates:
- Path=/circuit/**
filters:
- name: Retry
args:
retries: 3
method: GET
backoff:
firstBackoff: 50ms
maxBackoff: 500ms
- name: CircuitBreaker
args:
name: myCircuitBreaker #서킷브레이커 명.
fallbackUri: forward:/fallback
statusCodes:
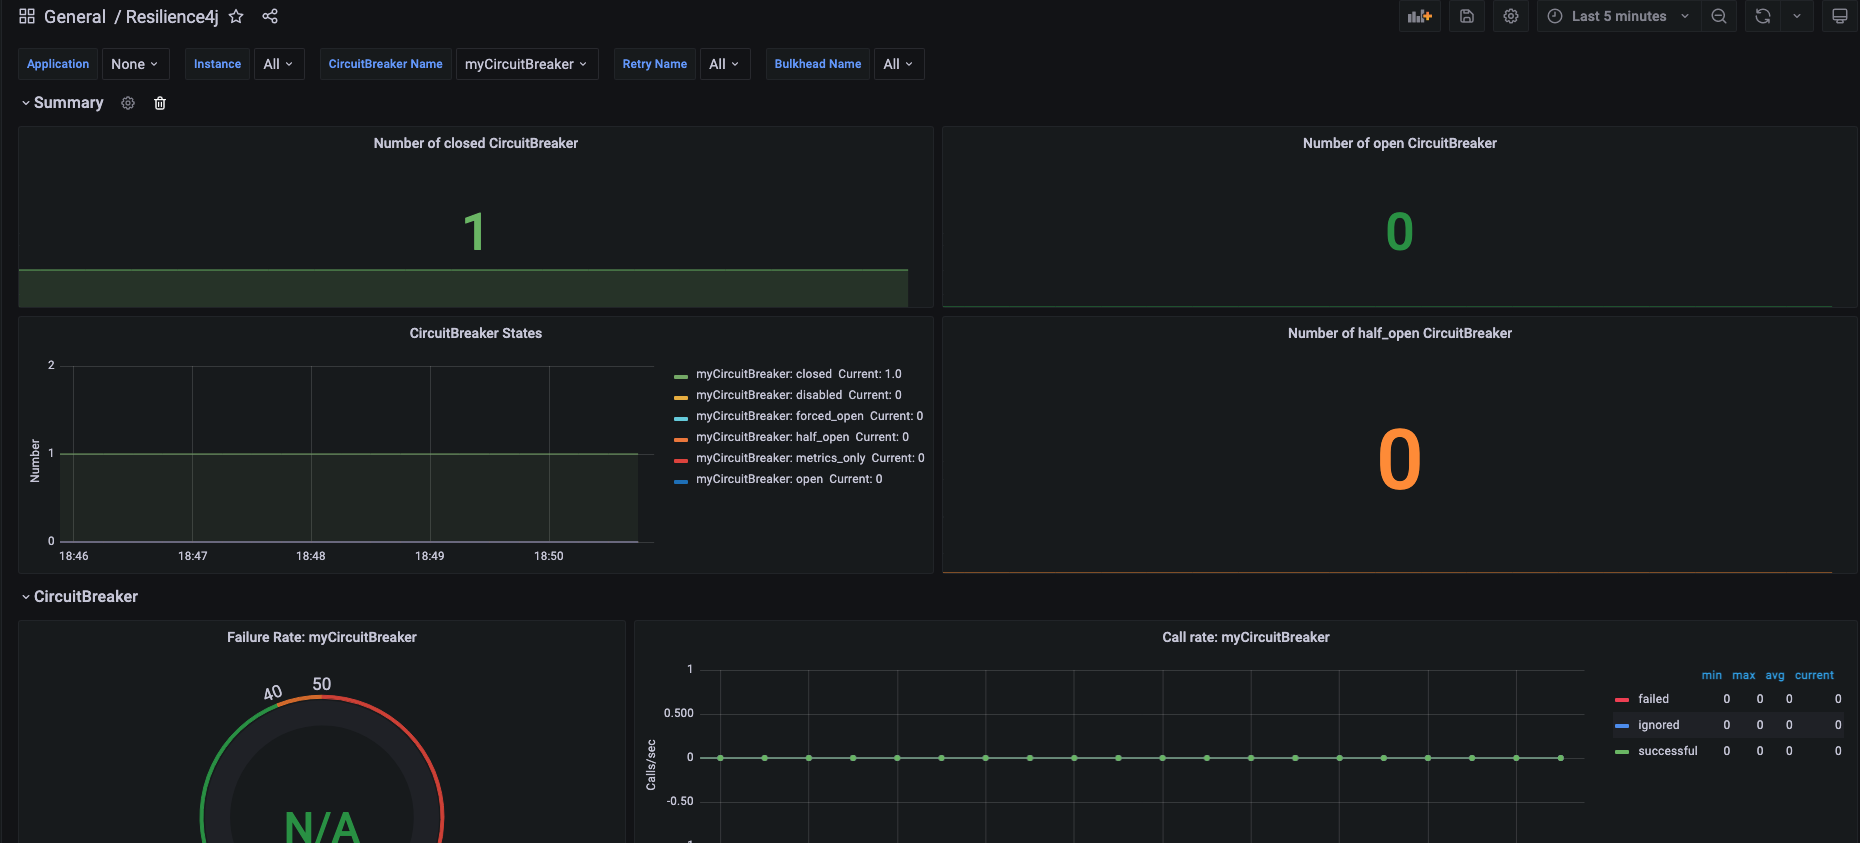
- 500예시로, 요청하려는 서버의 응답코드가 500 이면 서킷브레이커가 가동되고, 서킷브레이커의 네이밍을 지정할 수 있다. 이 네이밍 myCircuitBreaker 는 dashboard 에 찾을 수 있다.
스프링
<dependency>
    <groupId>org.springframework.boot</groupId>
    <artifactId>spring-boot-starter-actuator</artifactId>
</dependency>
<dependency>
    <groupId>org.springframework.cloud</groupId>
    <artifactId>spring-cloud-starter-circuitbreaker-reactor-resilience4j</artifactId>
</dependency>
<dependency>
    <groupId>io.micrometer</groupId>
    <artifactId>micrometer-registry-prometheus</artifactId>
</dependency> <!-- 모니터링 -->
모니터링을 위해 필요한 metric 을 제공하는 라이브러리는 micrometer-registry-prometheus 이다.
그리고 actuator 가 있어야, prometheus 가 데이터를 수집해줄 수 있다.
actuator 엔드포인트 /actuator/prometheus 로 데이터 수집한다.
http://localhost:포트/actuator/prometheus

과 같이 나온다.
프로메테우스 구성법
https://juntcom.tistory.com/188
프로메테우스 Prometheus 시작하기(docker)
프로메테우스란 - prometheus 란 오픈소스 모니터링 툴로 지표 수집을 통한 모니터링이 주요 기능이다. 쿠버네티스 뿐만 아니라 애플리케이션이나 서버, OS등 다양한 대상으로부터 지표(Metric)를 수
juntcom.tistory.com
prometheus.yml
서버에서 실행시
vi /etc/prometheus/prometheus.yml
global:
  scrape_interval: 10s # 10초마다 매트릭을 수집 default 1분
  evaluation_interval: 1m # 1분마다 규칙을 평가 default 1분

  external_labels: # 외부 시스템에 표시할 이 서버의 레이블
    monitor: 'monitor'

rule_files: # 규칙을 로딩하고 evaluation_interval 설정에 따라 정기적으로 평가한다.
# - "first.rules"
# - "second.rules"

scrape_configs:
  - job_name: 'circuit-breaker'
    metrics_path: '/actuator/prometheus' # 메트릭을 수집할 path 설정
    static_configs:
      - targets: [‘ip:포트’] #로컬도커인 경우 'host.docker.internal:포트'
도커 실행
docker run -d -p 9090:9090 -v /etc/prometheus:/etc/prometheus --name prometheus prom/prometheus
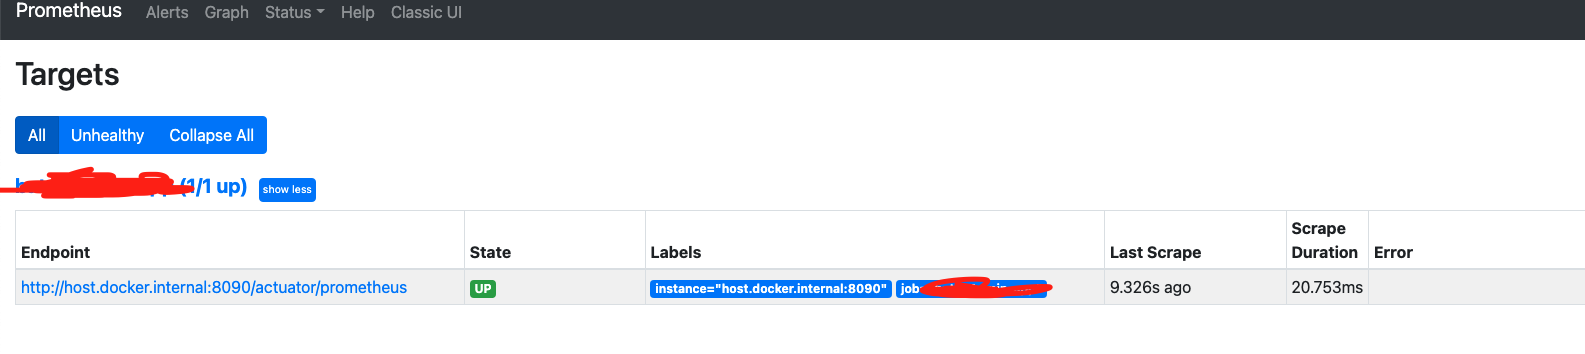
프로메테우스 실행 하면
http://localhost:9090/targets 에 수집하고 있는 target 들 현황을 볼 수 있다.
위의 데이터 수집까지 되었으면 prometheus 로 수집한 데이터를 grafana 로 데이터 보여주면 된다.
grafana 설치까지 하면 인프라 구성은 완료
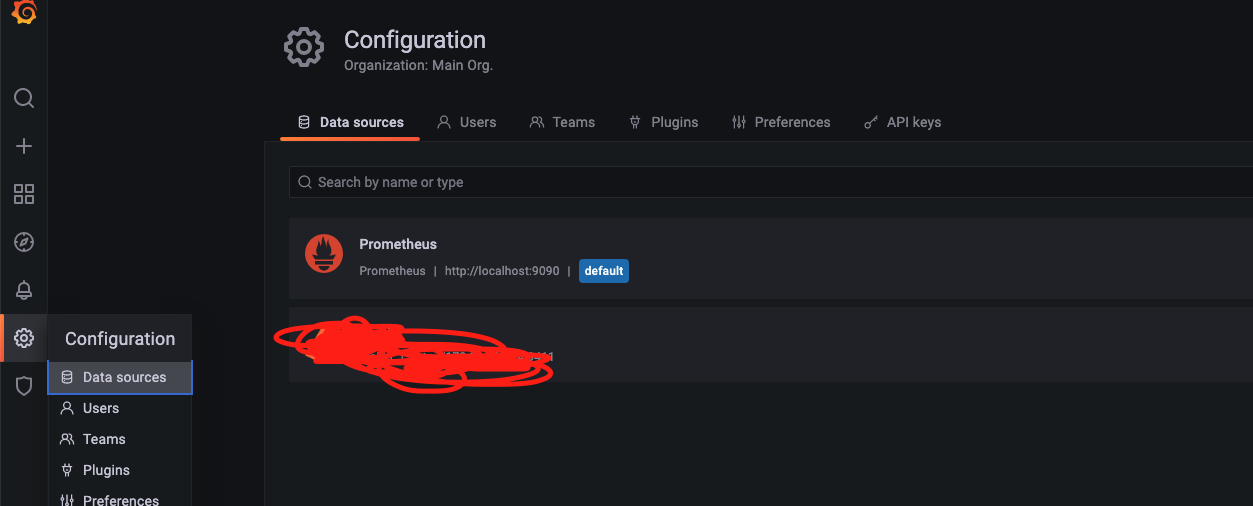
grafana 설치했으면 prometheus 를 datasource 추가하자.
다음에
https://resilience4j.readme.io/docs/grafana-1 대시보드 설치해주면된다.
https://github.com/resilience4j/resilience4j/blob/master/grafana_dashboard.json
GitHub - resilience4j/resilience4j: Resilience4j is a fault tolerance library designed for Java8 and functional programming
Resilience4j is a fault tolerance library designed for Java8 and functional programming - GitHub - resilience4j/resilience4j: Resilience4j is a fault tolerance library designed for Java8 and functi...
github.com
위 json 파일을 대시보드로 import 해주면 끝.
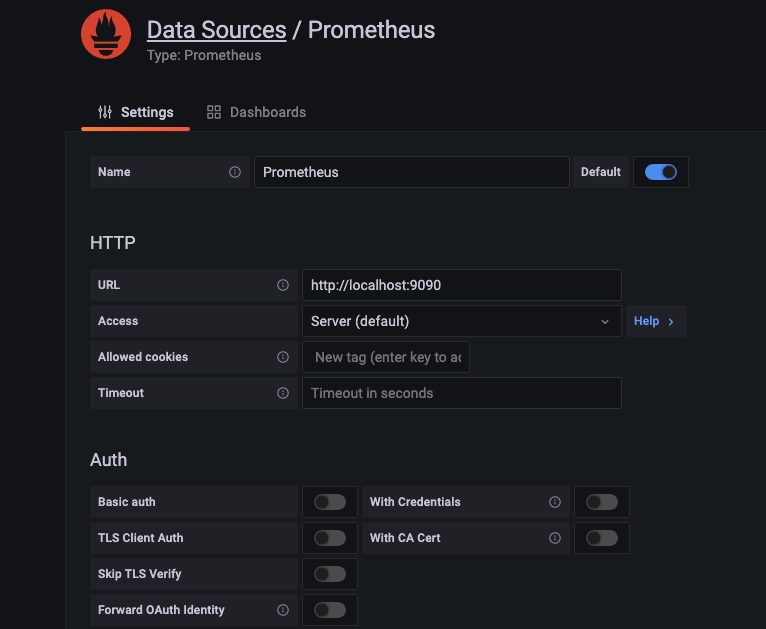
혹 데이터가 보이지 않으면, datasource 를 방금 추가해준 prometheus 설정으로 수정 하면 된다.
'인프라 > 모니터링' 카테고리의 다른 글
| [ELK] logstash 설치 및 실행하기 (0) | 2022.07.13 |
|---|---|
| telegraf 시작하기 (0) | 2022.01.04 |
| Burrow 시작하기 (0) | 2021.12.30 |
| ZIPKIN 시작하기 (0) | 2021.11.25 |
| 프로메테우스 Prometheus 시작하기(docker) (0) | 2021.11.04 |